Every webinar program reports to three audiences. Leadership wants to know what pipeline the program touched. The marketer running it wants to know which sessions held attention and who registered but never showed up. Sales wants to know who watched, which account they work for, and whether there's already an open deal.
Most teams answer those questions with exports. You pull the attendee list for each session, match people to accounts in the CRM, look up open deals, build a follow-up list for each rep, and then roll it all into a slide for leadership. By the time the slide is done, the next session has already happened.
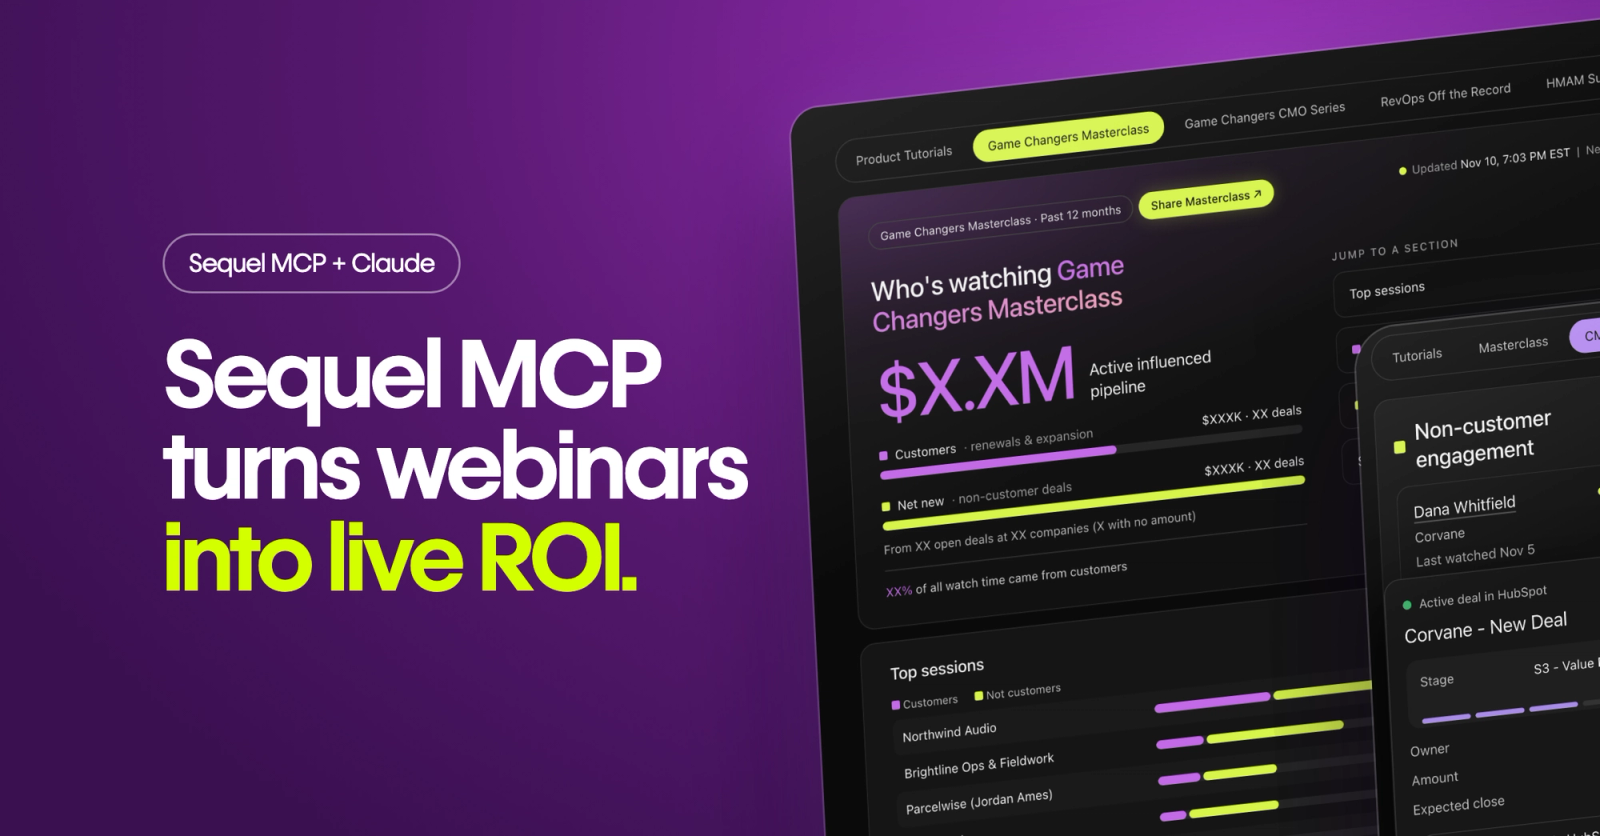
Joey Alvandi on our team replaced that process with a live dashboard. He connected Claude to Sequel's MCP server and our CRM and built one branded tab for each of our event series, styled with the same theme each series uses in Sequel. The dashboard refreshes twice a day and anyone on the team can open it on a laptop or a phone. It's now a locked template, so adding a new series is as simple as adding a tab.
Sequel's MCP works with any LLM or AI platform, so you can follow along in Claude or in whatever AI tool your company has standardized on.
What this reporting costs without a dashboard
One of our customers, a Senior Marketing Leader, described the manual version this way: "Our campaign managers used to spend 2 to 3 hours per event pulling this information and getting sales what they needed to follow up."
That's per event. Add the monthly roll-up for leadership and the one-off questions from reps, and the hours climb fast. Here's our estimate for a modest program running four series with two sessions a month each:
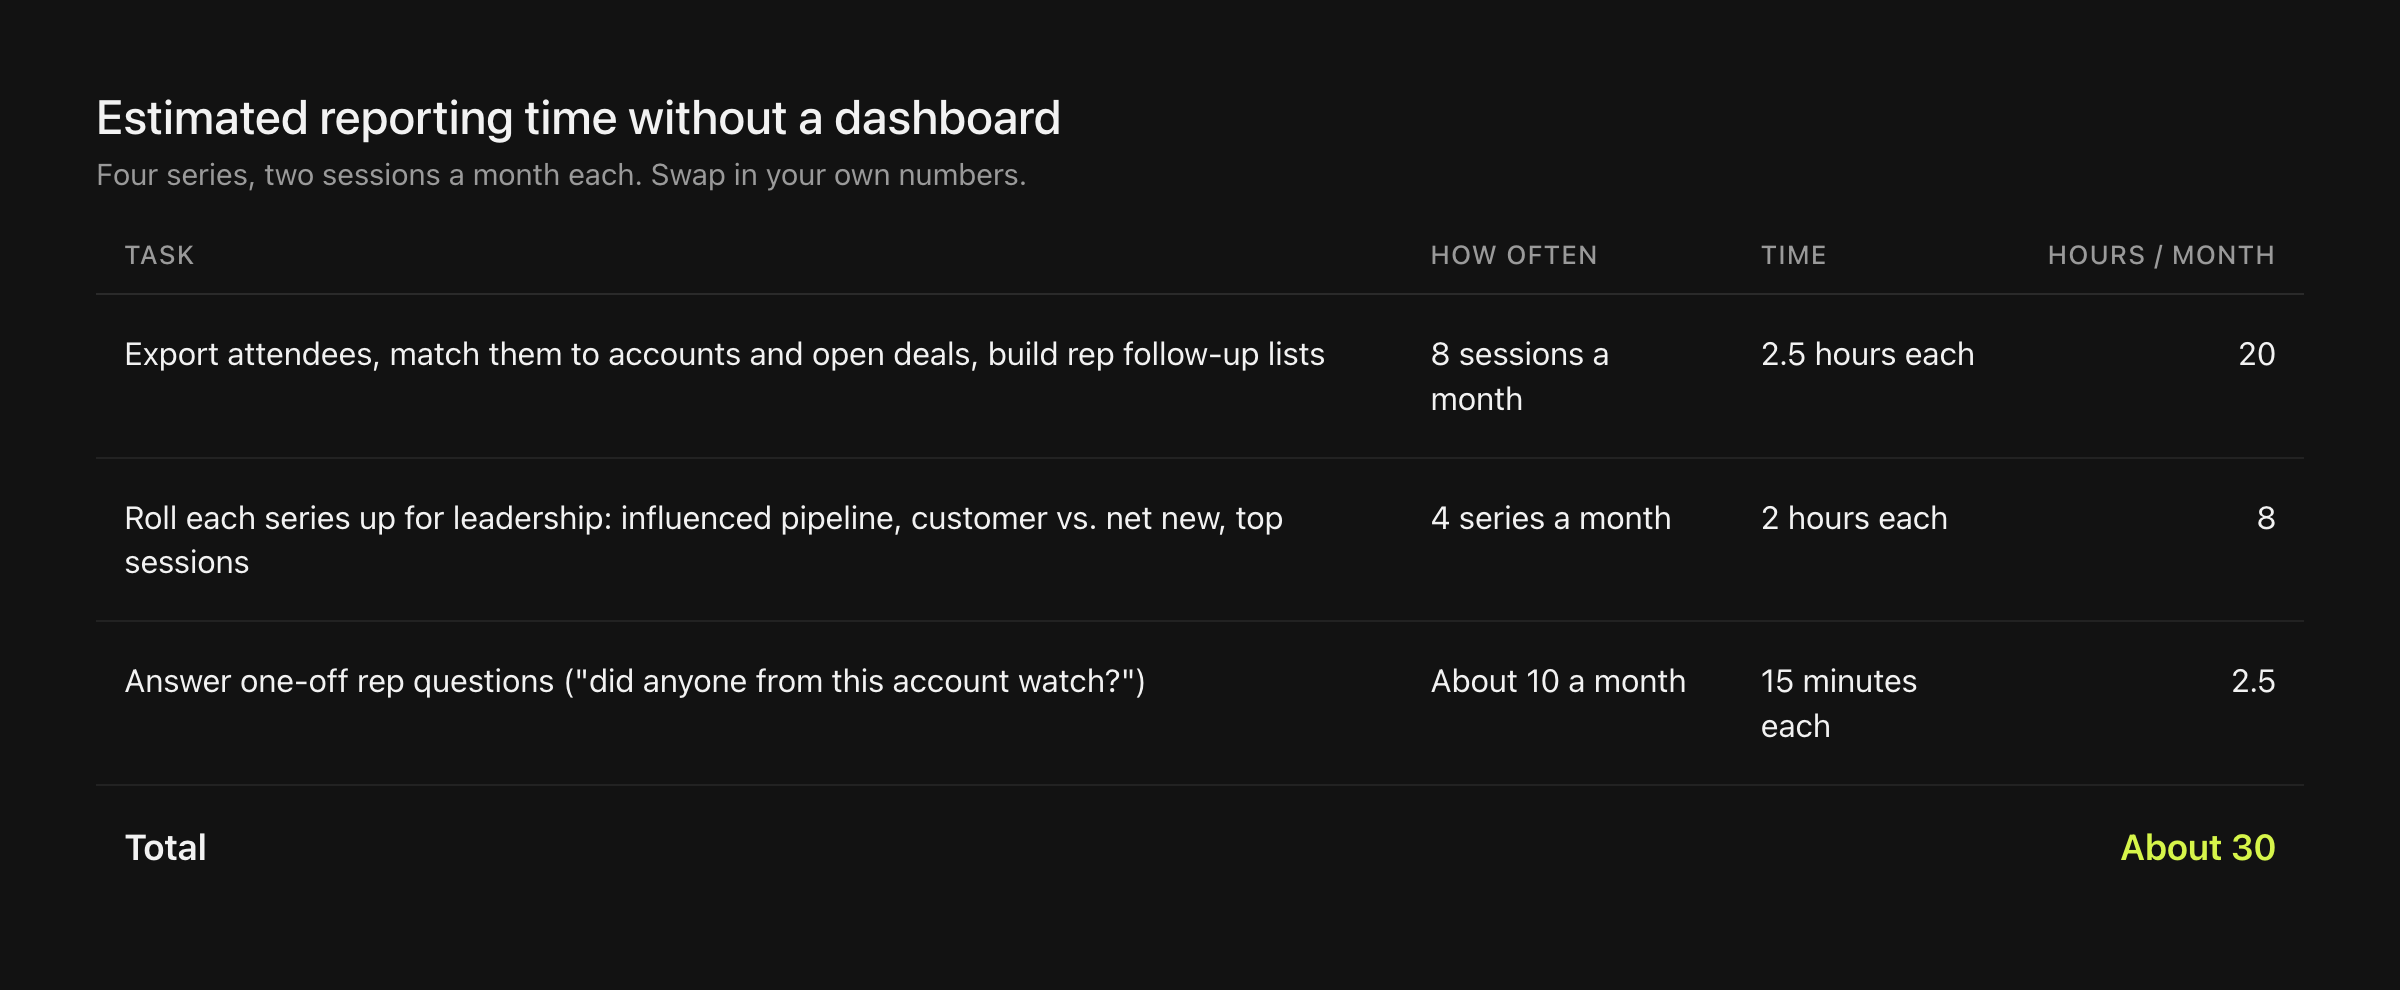
That's roughly 360 hours a year, or about nine 40-hour weeks, spent assembling reports. Your numbers will differ, so swap in your own session count and hours. With the dashboard, the assembly work goes away. What's left is reading it and deciding what to do next with the information and insights it provides.
What's on the dashboard
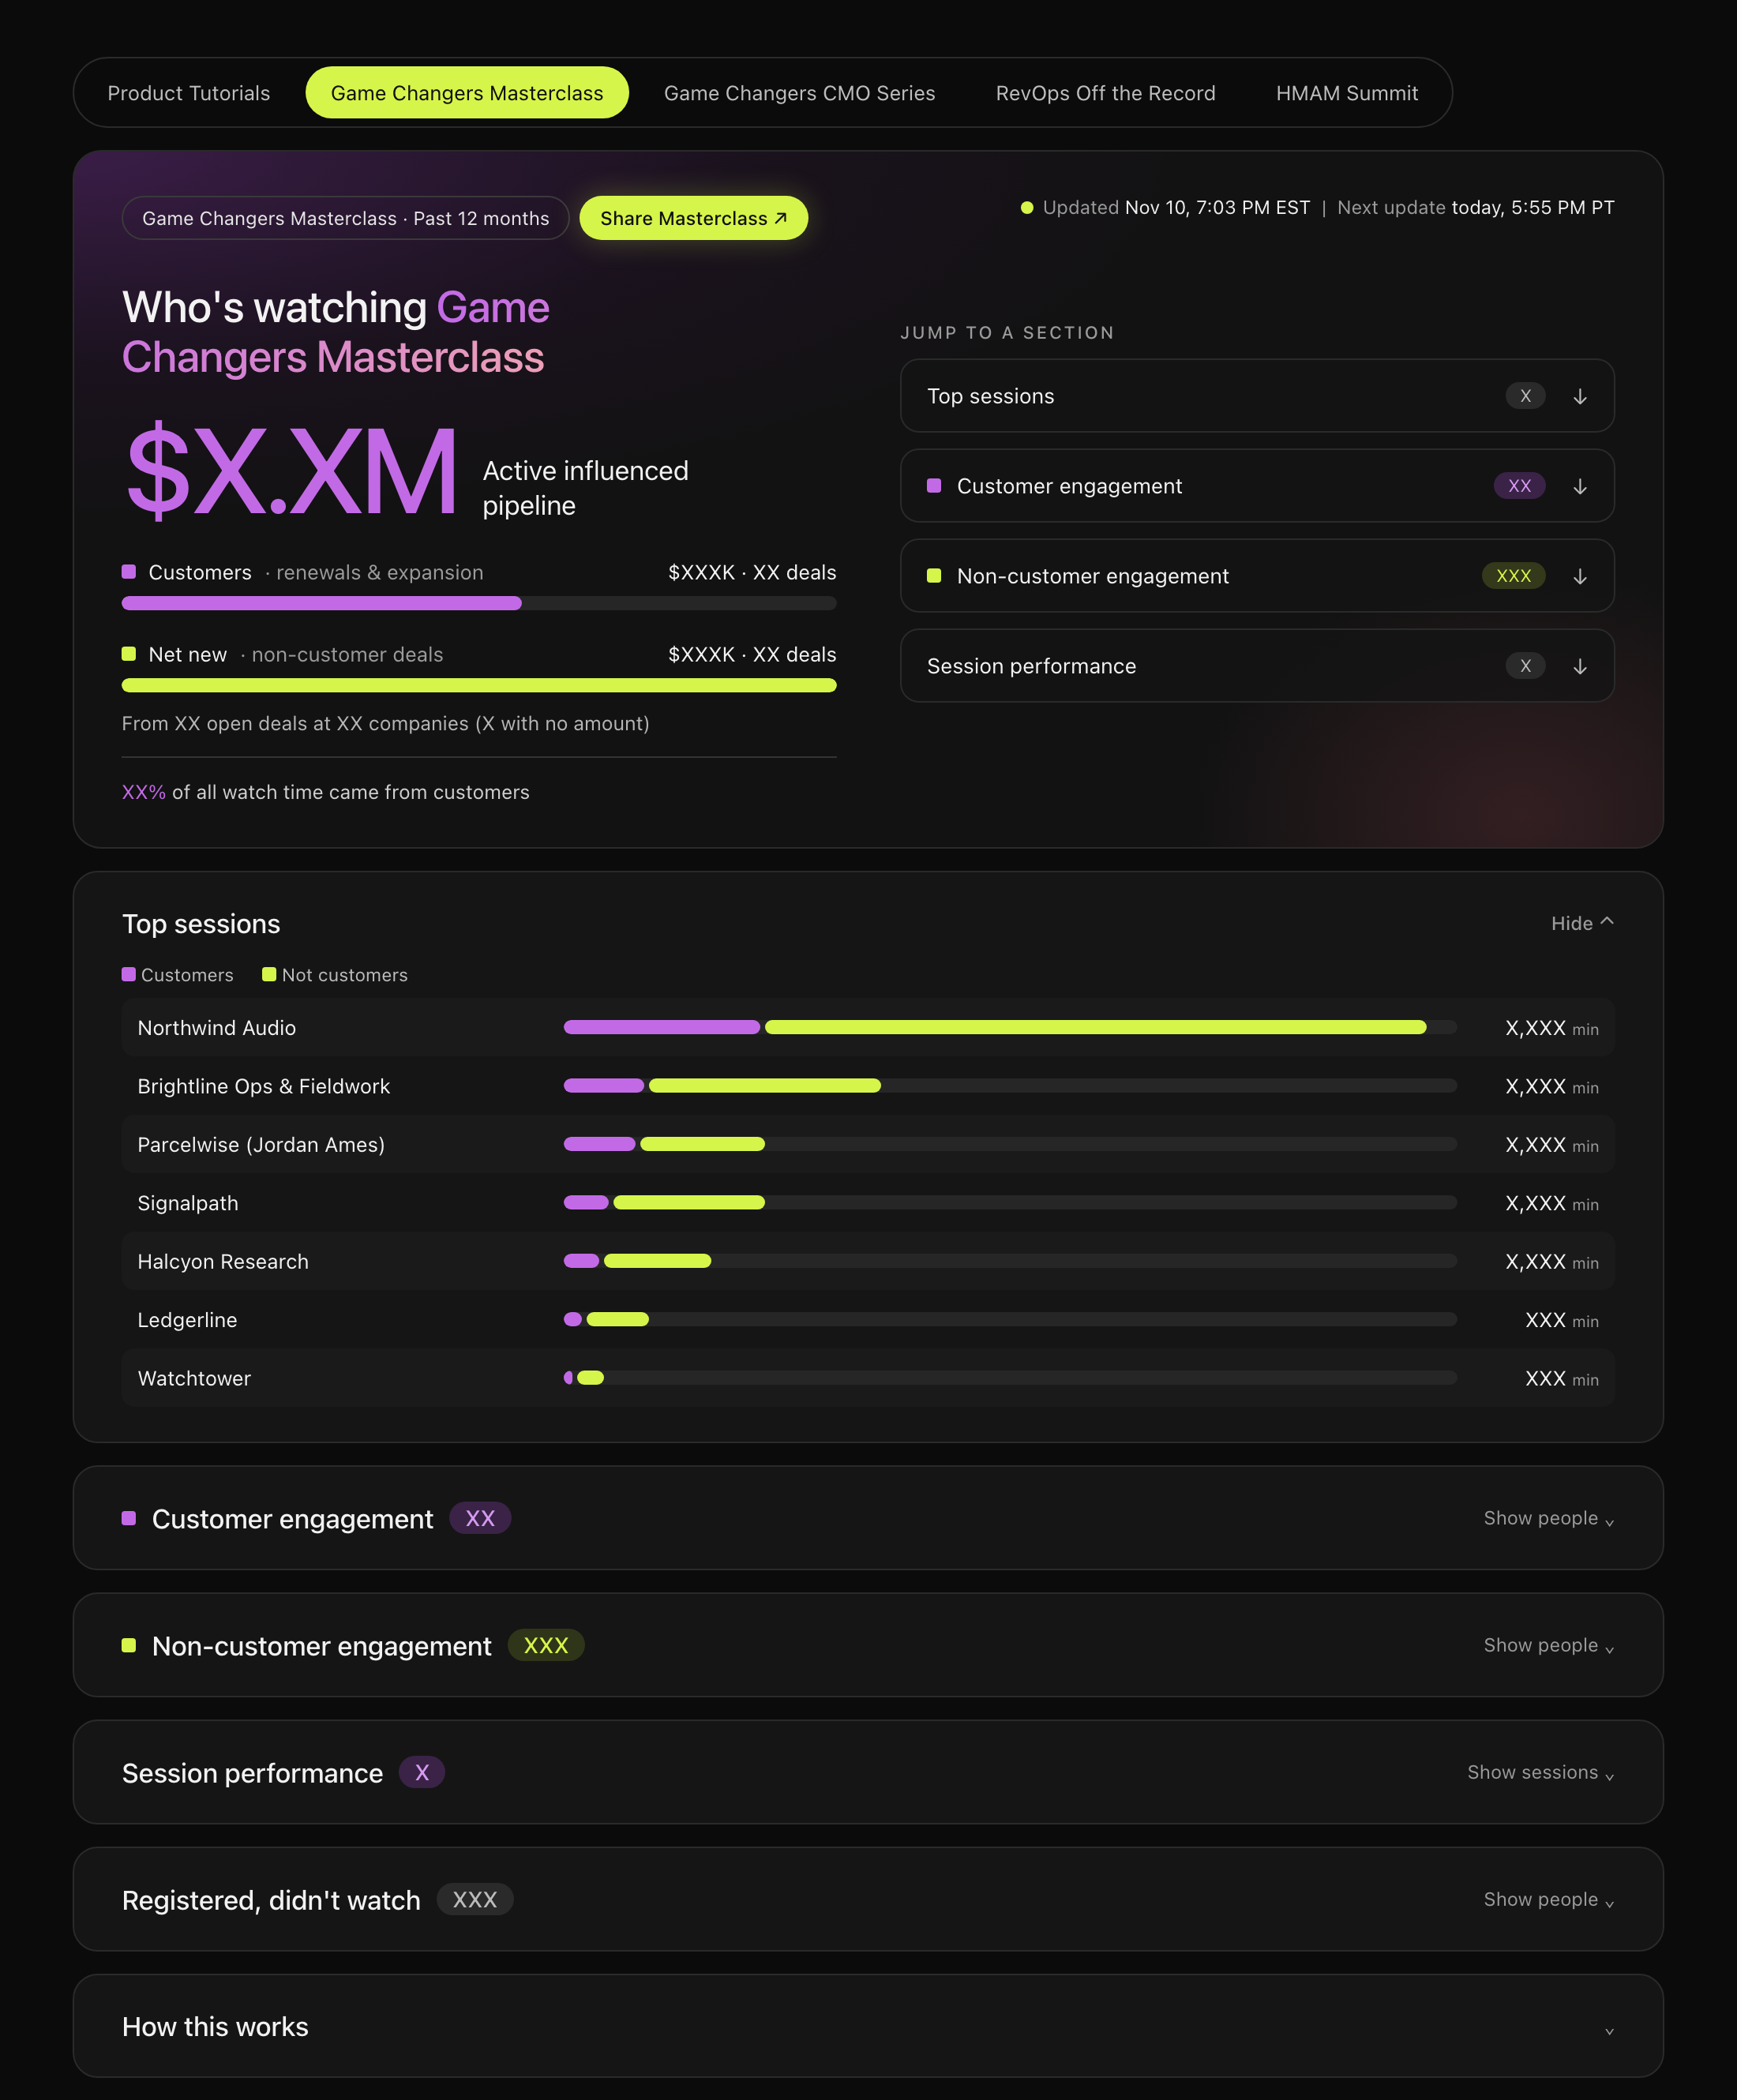
Each tab covers one of Sequel's video series over the past 12 months and has the same sections (all data in the visuals shared here is fictional, and customer and prospect names are anonymized):
- Active influenced pipeline. The total value of open deals at companies whose people watched the series, split into customers (renewals and expansion) and net new. A line underneath shows how many open deals and companies the total comes from, plus the share of all watch time that came from customers.
- Top sessions. Each session is ranked by total watch minutes, with the bar split between customer and non-customer viewing.
- Customer engagement and non-customer engagement. Everyone who watched, sorted by engagement score, with their company and the date they last watched. If their company has an open deal, an "Active deal" badge opens the deal's stage, owner, amount and expected close date, with a link to the deal in the CRM. Chips under each person show colleagues from the same company who also watched, so you get an accurate picture of the full buying committee's engagement.
- Session performance. Results for each session in the series.
- Registered, didn't watch. Everyone who signed up but never watched live or on demand.
- How this works. The definitions behind every number on the page.
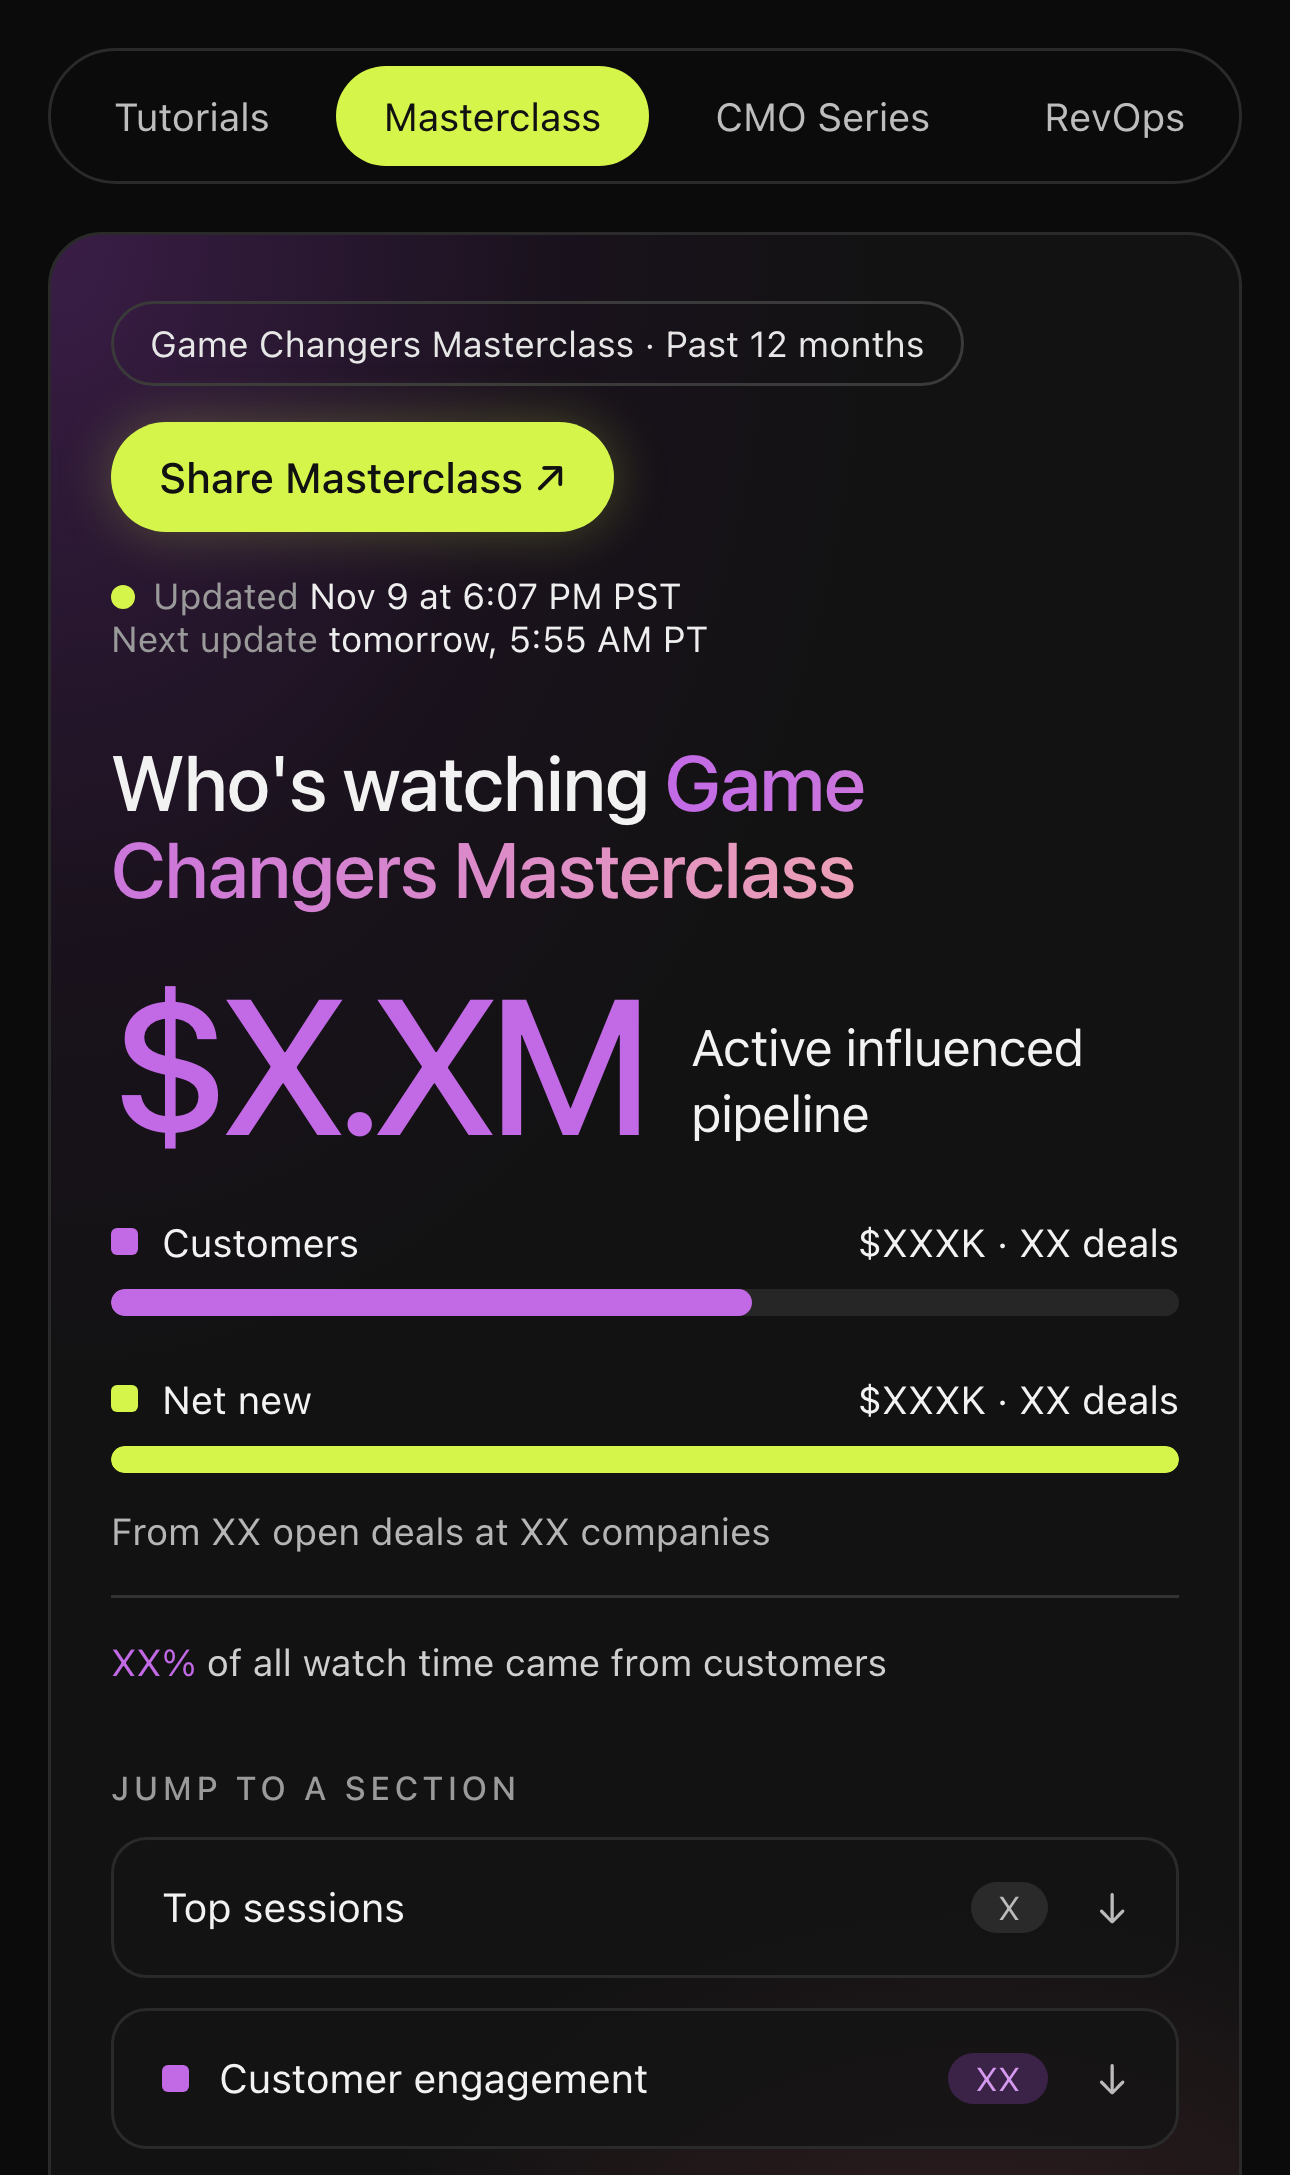
The top of each tab shows when the data was last updated and when the next update will run. Each tab also has a share button, and the whole page works on mobile, which is where many reps will open it.
What you need
- Sequel's MCP server connected to your AI tool. This gives the AI read access to all of your Sequel data, including your events, registrants, watch time and engagement data. Each Sequel MCP tool runs with the permissions of your Sequel role, so someone who can't see individual attendee activity in Sequel can't pull it through the MCP either.
- A connection to your CRM. The AI needs to read company records and open deals. We use HubSpot.
- A place to publish the page. We used Claude Artifacts, which are private by default and can be shared with the team. If you work in a different AI tool, publish wherever your team keeps internal tools.
How to build it, step by step
The prompts below are written in plain language so they work in any AI tool connected to Sequel's MCP. Replace the bracketed parts with your own details.
Step 1: Write down the questions before you design anything
List what each audience asks you every month. Every section of the dashboard should answer one of those questions. Ours were:
- What open pipeline has this series touched, and how much of it is new business versus customers?
- Which sessions held attention, and with whom?
- Who watched, and does their company have an open deal?
- Who registered and never watched?
If a chart doesn't answer a question on your list, leave it out.
Step 2: Pull the events in each series
Sequel's MCP can list every event in your account and filter by name, so you can group sessions by series.
Using Sequel, list every event from the past 12 months whose name includes "[series name]". Show the event name, date and event ID. Flag anything that looks like it belongs to a different series.
Check the list before you go further. Test events and one-off sessions with similar names are easy to sweep in by accident.
Step 3: Pull who registered, who watched and for how long
For each event that has ended, Sequel returns every participant's registration status along with their live and on-demand watch minutes, chat messages, poll votes and questions asked.
For each event in that list, pull the participant list with registration status and live and on-demand watch minutes. Combine them into one table of people for the series, with total watch minutes, number of sessions watched, the date they last watched, and their company. Keep a separate list of people who registered for at least one session and never watched.
Step 4: Roll people up to accounts and match them to your CRM
This is the step that turns attendance data into pipeline data.
Match each company in the series table to a company in [your CRM]. For each one, tell me whether it's a current customer and list any open deals with deal name, stage, owner, amount and expected close date. Show me every company you couldn't match and why.
Read the unmatched list. Personal email addresses, subsidiaries and duplicate company records in the CRM all cause misses, and it's better to fix them once here than to have a rep find the gap.
Step 5: Apply your Sequel branding
Styling the dashboard with your Sequel theme makes the report look like the program it's reporting on.
Pull our brand theme from Sequel: colors, fonts and logo. Use it to style the [series name] tab.
Step 6: Build the page, one section per question
Build a dashboard page with one tab per series. For each tab, show: (1) total open pipeline at companies that watched, split into customers and net new, with the deal and company counts behind it and the share of watch time that came from customers; (2) sessions ranked by total watch minutes, split by customer and non-customer; (3) customer and non-customer viewers sorted by engagement, with company, last watched date, and an "Active deal" badge that shows the deal's stage, owner, amount and close date, plus chips for colleagues at the same company who also watched; (4) people who registered and never watched; (5) a "How this works" section that defines every number. Make it work on a phone.
Then review it the way each audience would. Open it on your phone and look for the follow-up list a rep would want. Ask whether leadership would understand the top number without you in the room.
Step 7: Lock the template and add series
Once one tab works, freeze the layout so every series is reported the same way.
Treat this tab's layout and definitions as the template. Add a new tab for [series name] using the same sections, the same definitions and our Sequel theme. Don't change any existing tab.
Step 8: Keep it fresh
Ours refreshes twice a day and shows the last and next update time at the top of every tab, so nobody has to wonder whether the numbers are current. Set the data pull to re-run on a schedule in your AI tool rather than refreshing it by hand.
How each audience uses it
Leadership: is the program paying off?
The top number on each tab answers the question leadership asks most: what open pipeline has this series touched? The customer and net-new split tells you what kind of program it is. A series where most of the pipeline is net new is doing acquisition work. A series where most of the pipeline and watch time come from customers is doing expansion and retention work, and it should be measured that way.
Influenced pipeline doesn't mean the webinar created the deal. It means people at a company with an open deal spent time with your content. That's a useful signal for where a program is landing, and the "How this works" section spells out exactly what's counted so nobody reads more into it than it says.
The marketer: what's working?
The top sessions chart ranks every session by watch minutes and shows who those minutes came from. Two sessions with similar attendance can look very different here: one pulls net-new viewers who stay for the whole session, and another mostly draws existing customers. That's the input for next quarter's topics and speakers.
The "Registered, didn't watch" list is a ready-made on-demand campaign. These people raised their hand for the topic. Send them the replay and the clip most relevant to them.
Sales: who do I call, and what do I say?
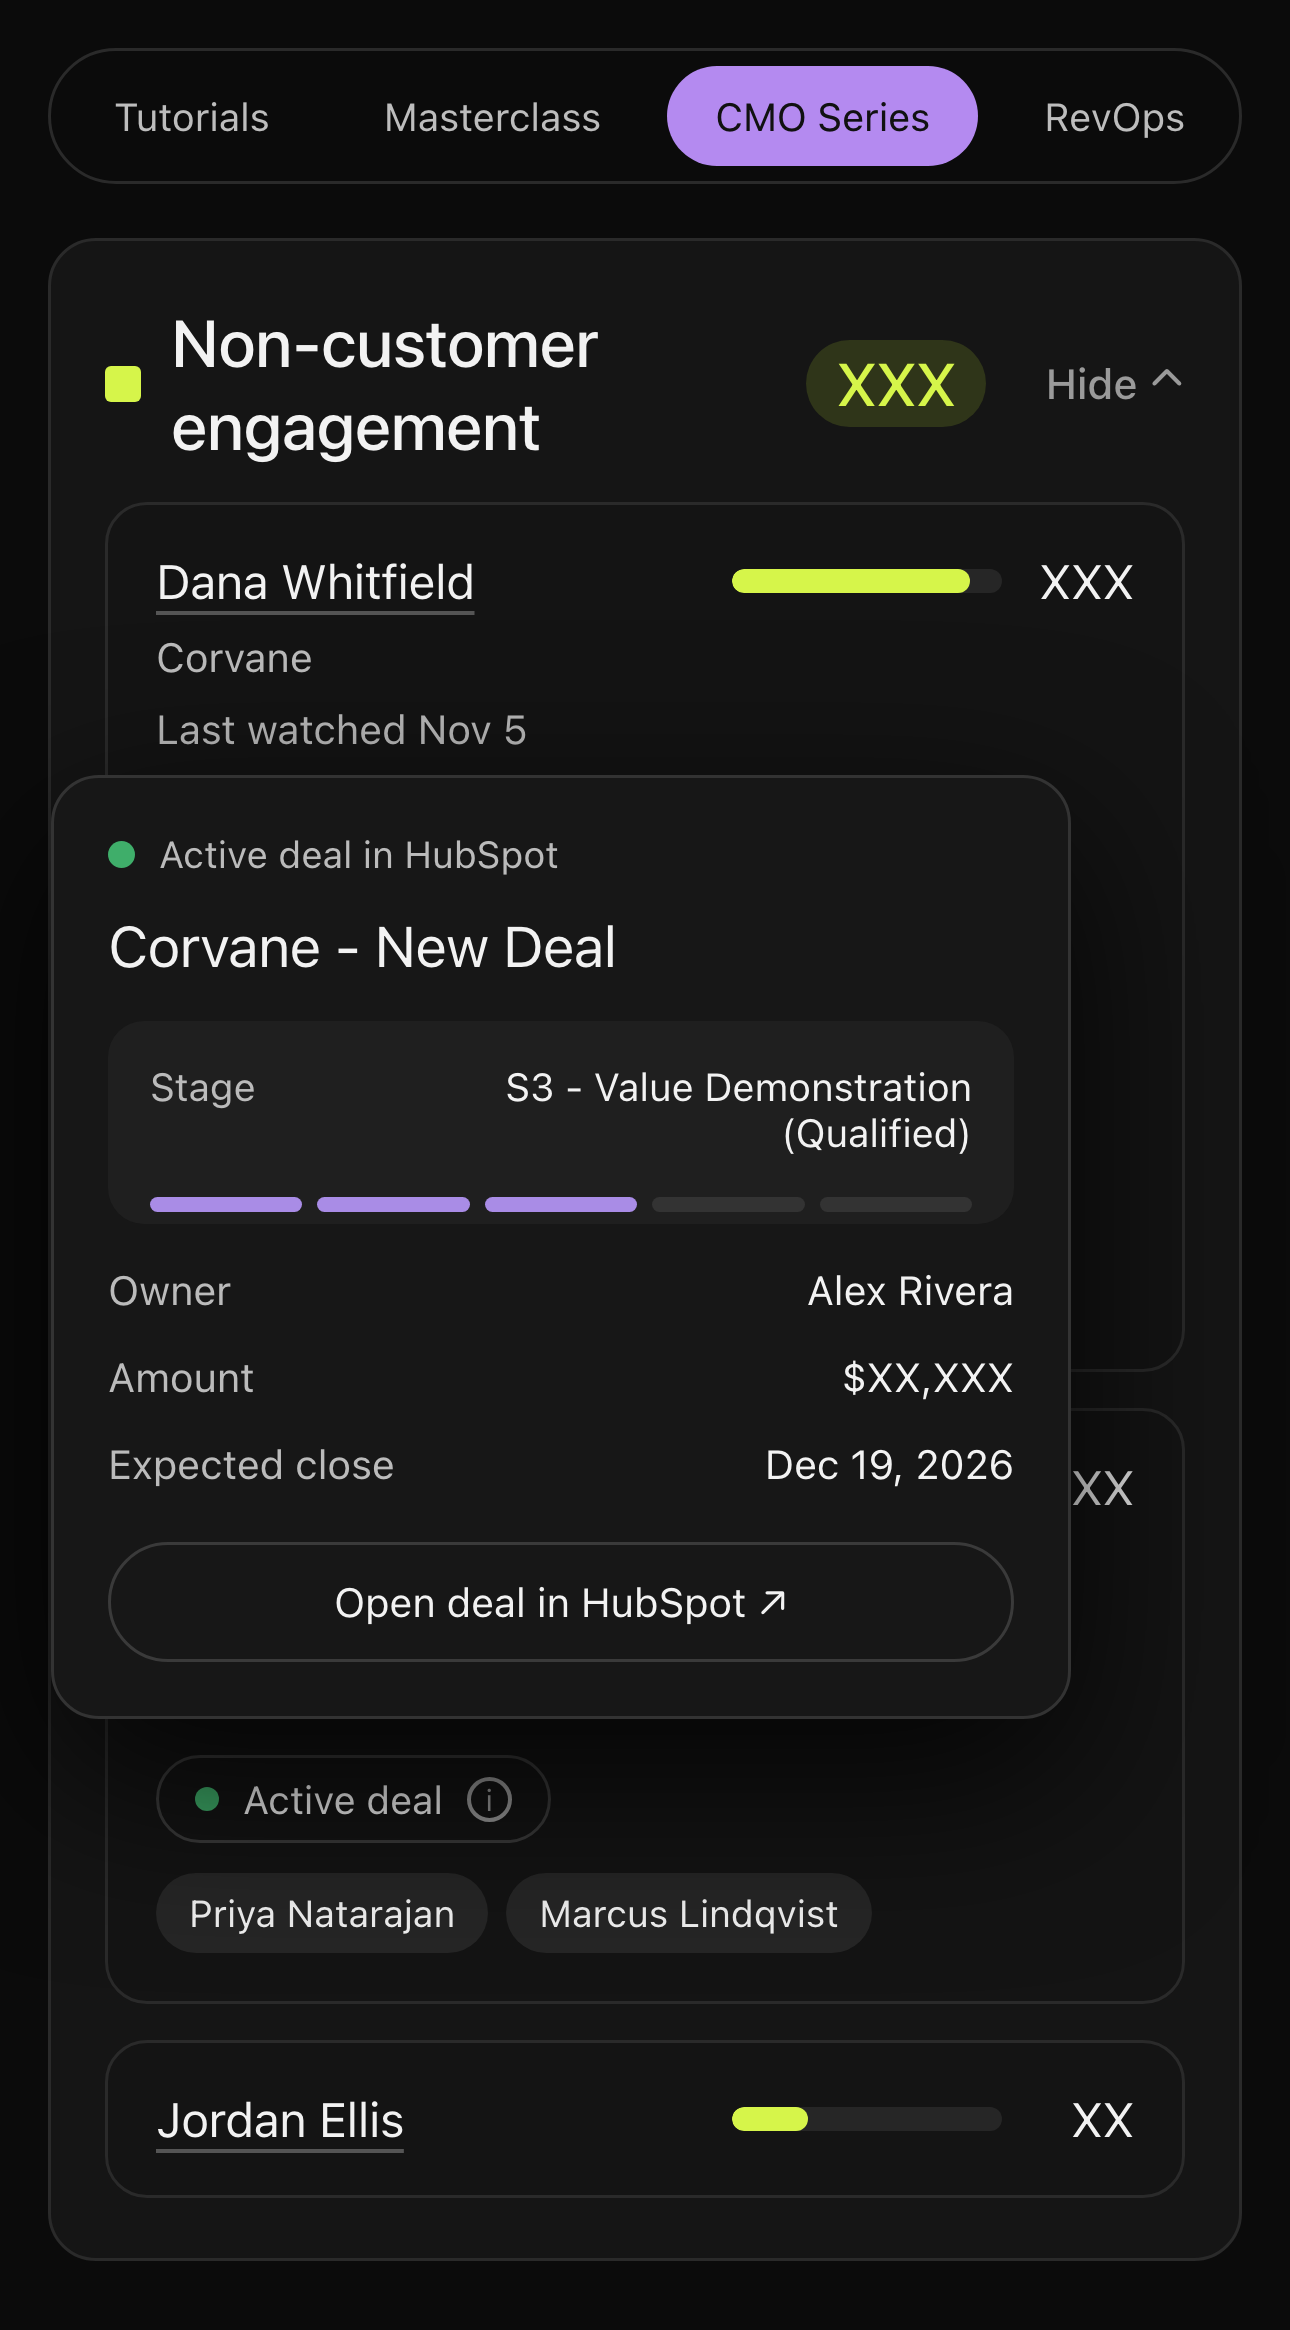
Reps open the engagement lists. Each person shows how engaged they were and when they last watched, so a rep can tell a hot follow-up from a cold one at a glance. The deal badge shows whether the account is already in play, at what stage and with whom, without leaving the page.
If a champion at an open deal watched a session and two people from their team did too, the rep has a reason to reach out to all three, and a topic to open with: the session they watched. That makes the follow-up more useful than a generic "thanks for attending."
Guardrails we'd recommend
- Define every number on the page. Influenced pipeline, engagement and "customer" can each be calculated several ways. Write down which one you used and put it in the dashboard itself.
- Keep it internal. The dashboard shows prospect names and deal values. Share it with your team, not outside the company.
- Treat it as a guide for follow-up, not an attribution model. Use it to decide where your team spends follow-up time, not to decide who gets credit for a deal.
- Check the CRM matches. Review the unmatched companies from Step 4 now and then, especially after big events.
Start with one series
You don't need five tabs on day one. Pick the series leadership asks about most, build that tab, and use it for a month. Once the questions stop coming to you because the answers are already on the page, lock the template and add the next series.
Want to see what Sequel's MCP and Sequel Agents can do with your own webinar data? Get a demo.